<template>
<div>
<lt-canvas ref="canvas" :width="750" :height="500"></lt-canvas>
</div>
</template>
<script>
import LightChart from 'light-chart';
export default {
components:{
ltCanvas:require("light-chart/canvas")
},
data(){
return {}
},
mounted(){
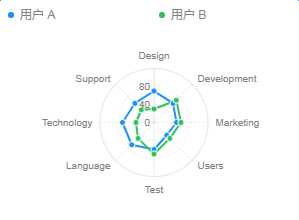
const data = [
{ item: 'Design', user: '用户 A', score: 70 },
{ item: 'Design', user: '用户 B', score: 30 },
{ item: 'Development', user: '用户 A', score: 60 },
{ item: 'Development', user: '用户 B', score: 70 },
{ item: 'Marketing', user: '用户 A', score: 50 },
{ item: 'Marketing', user: '用户 B', score: 60 },
{ item: 'Users', user: '用户 A', score: 40 },
{ item: 'Users', user: '用户 B', score: 50 },
{ item: 'Test', user: '用户 A', score: 60 },
{ item: 'Test', user: '用户 B', score: 70 },
{ item: 'Language', user: '用户 A', score: 70 },
{ item: 'Language', user: '用户 B', score: 50 },
{ item: 'Technology', user: '用户 A', score: 70 },
{ item: 'Technology', user: '用户 B', score: 40 },
{ item: 'Support', user: '用户 A', score: 60 },
{ item: 'Support', user: '用户 B', score: 40 }
];
let chart = new LightChart.Chart({
ltCanvas:this.$refs.canvas
});
chart.coord('polar');
chart.source(data, {
score: {
min: 0,
max: 120,
nice: false,
tickCount: 4
}
});
chart.axis('score', {
label(text, index, total) {
if (index === total - 1) {
return null;
}
return {
top: true
};
},
grid: {
lineDash: null,
type: 'arc'
}
});
chart.axis('item', {
line: {
lineWidth: 1,
stroke: '#e8e8e8'
}
});
chart.line().position('item*score').color('user');
chart.point().position('item*score').color('user').style({
stroke: '#fff',
lineWidth: 1
});
chart.render();
}
}
</script>
<style scoped>
</style>
|