<template>
<div>
<lt-canvas ref="canvas" :width="750" :height="500"></lt-canvas>
</div>
</template>
<script>
import LightChart from 'light-chart';
export default {
components:{
ltCanvas:require("light-chart/canvas")
},
data(){
return {}
},
mounted(){
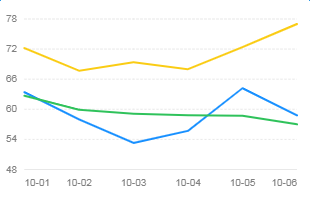
const data = [
{ value: 63.4, city: 'New York', date: '2011-10-01' },
{ value: 62.7, city: 'San Francisco', date: '2011-10-01' },
{ value: 72.2, city: 'Austin', date: '2011-10-01' },
{ value: 58, city: 'New York', date: '2011-10-02' },
{ value: 59.9, city: 'San Francisco', date: '2011-10-02' },
{ value: 67.7, city: 'Austin', date: '2011-10-02' },
{ value: 53.3, city: 'New York', date: '2011-10-03' },
{ value: 59.1, city: 'San Francisco', date: '2011-10-03' },
{ value: 69.4, city: 'Austin', date: '2011-10-03' },
{ value: 55.7, city: 'New York', date: '2011-10-04' },
{ value: 58.8, city: 'San Francisco', date: '2011-10-04' },
{ value: 68, city: 'Austin', date: '2011-10-04' },
{ value: 64.2, city: 'New York', date: '2011-10-05' },
{ value: 58.7, city: 'San Francisco', date: '2011-10-05' },
{ value: 72.4, city: 'Austin', date: '2011-10-05' },
{ value: 58.8, city: 'New York', date: '2011-10-06' },
{ value: 57, city: 'San Francisco', date: '2011-10-06' },
{ value: 77, city: 'Austin', date: '2011-10-06' },
];
let chart = new LightChart.Chart({
ltCanvas:this.$refs.canvas
});
chart.source(data, {
date: {
range: [ 0, 1 ],
type: 'timeCat',
mask: 'MM-DD'
},
value: {
tickCount: 5
}
});
chart.legend(false);
chart.axis('date', {
label(text, index, total) {
const textCfg = {};
if (index === 0) {
textCfg.textAlign = 'left';
}
if (index === total - 1) {
textCfg.textAlign = 'right';
}
return textCfg;
}
});
chart.line().position('date*value').color('city');
chart.render();
}
}
</script>
<style scoped>
</style>
|