<template>
<div>
<lt-canvas ref="canvas" :width="750" :height="500"></lt-canvas>
</div>
</template>
<script>
import LightChart from 'light-chart';
export default {
components:{
ltCanvas:require("light-chart/canvas")
},
data(){
return {}
},
mounted(){
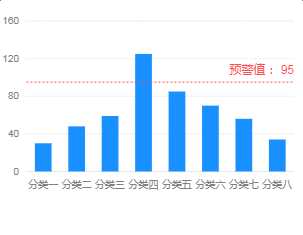
var data = [
{ x: '分类一', y: 30 },
{ x: '分类二', y: 48 },
{ x: '分类三', y: 59 },
{ x: '分类四', y: 125 },
{ x: '分类五', y: 85 },
{ x: '分类六', y: 70 },
{ x: '分类七', y: 56 },
{ x: '分类八', y: 34 },
];
let chart = new LightChart.Chart({
ltCanvas:this.$refs.canvas
});
chart.source(data, {
y: {
tickCount: 5
}
});
chart.interval().position('x*y');
chart.guide().line({
start: [ 'min', 95 ],
end: [ 'max', 95 ],
style: {
stroke: '#FF4D4F',
lineDash: [ 2 ]
}
});
chart.guide().text({
position: [ 'max', 95 ],
content: '预警值: 95',
offsetY: -5,
style: {
fill: '#FF4D4F',
textAlign: 'end',
textBaseline: 'bottom'
}
});
chart.render();
}
}
</script>
|