<template>
<div>
<lt-canvas ref="canvas" :width="750" :height="500"></lt-canvas>
</div>
</template>
<script>
import LightChart from 'light-chart';
export default {
components:{
ltCanvas:require("light-chart/canvas")
},
data(){
return {}
},
mounted(){
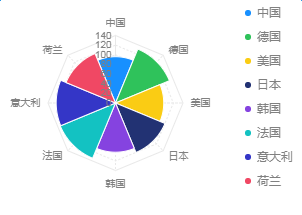
const data = [
{ country: '中国', cost: 96 },
{ country: '德国', cost: 121 },
{ country: '美国', cost: 100 },
{ country: '日本', cost: 111 },
{ country: '韩国', cost: 102 },
{ country: '法国', cost: 124 },
{ country: '意大利', cost: 123 },
{ country: '荷兰', cost: 111 }
];
let chart = new LightChart.Chart({
ltCanvas:this.$refs.canvas
});
chart.source(data, {
'cost': {
min: 0
}
});
chart.coord('polar');
chart.legend({
position: 'right'
});
chart.axis('cost', {
label: {
top: true
},
grid(text, index) {
if (text === '140') {
return {
lineDash: null
};
}
},
line: {
top: false
}
});
chart.interval()
.position('country*cost')
.color('country')
.style({
lineWidth: 1,
stroke: '#fff'
});
chart.render();
}
}
</script>
<style scoped>
</style>
|