import LightChart from 'light-chart';
export default {
components:{
ltCanvas:require("light-chart/canvas"),
webCanvas:require("light-chart/webCanvas")
},
data(){
return {}
},
mounted(){
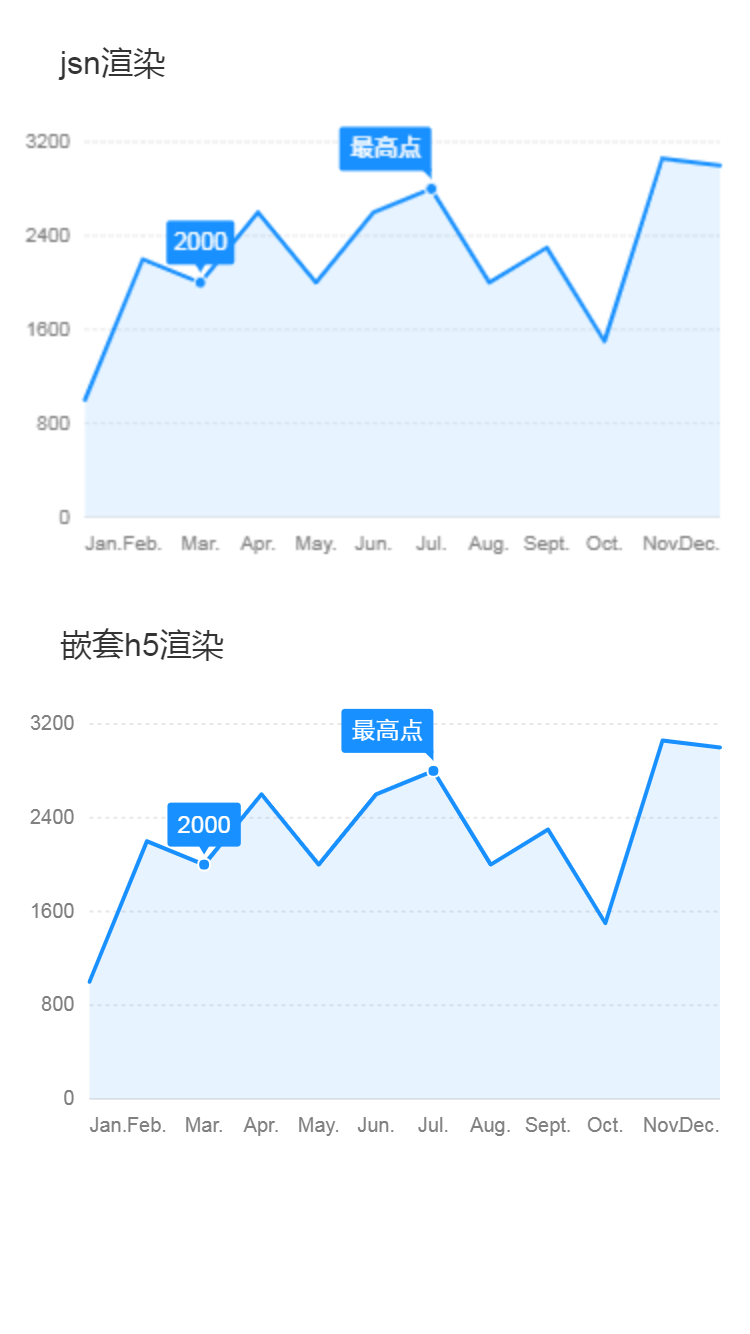
const data = [
{ time: 'Jan.', tem: 1000 },
{ time: 'Feb.', tem: 2200 },
{ time: 'Mar.', tem: 2000 },
{ time: 'Apr.', tem: 2600 },
{ time: 'May.', tem: 2000 },
{ time: 'Jun.', tem: 2600 },
{ time: 'Jul.', tem: 2800 },
{ time: 'Aug.', tem: 2000 },
{ time: 'Sept.', tem: 2300 },
{ time: 'Oct.', tem: 1500 },
{ time: 'Nov.', tem: 3060 },
{ time: 'Dec.', tem: 3000 },
];
const scale = {
time: {
range: [ 0, 1 ]
},
tem: {
tickCount: 5,
min: 0
}
}
let chart = new LightChart.Chart({
ltCanvas:this.$refs.canvas
});
chart.source(data);
chart.scale(scale);
chart.axis('time', {
label(text, index, total) {
var textCfg = {};
if (index === 0) {
textCfg.textAlign = 'left';
}
if (index === total - 1) {
textCfg.textAlign = 'right';
}
return textCfg;
}
});
chart.tooltip({
showCrosshairs: true,
onShow(ev) {
var { items } = ev;
items[0].name = items[0].title;
}
});
chart.guide().tag({
position: [6, 2800],
content: '最高点',
offsetY: -5,
direct: 'tl'
});
chart.guide().tag({
position: [2, 2000],
content: '2000',
offsetY: -5,
direct: 'tc'
});
chart.area().position('time*tem');
chart.line().position('time*tem');
chart.render();
this.$refs.webCanvas.draw(`
chart.source(${JSON.stringify(data)});
chart.scale(${JSON.stringify(scale)});
chart.axis('time', {
label:function(text, index, total) {
var textCfg = {};
if (index === 0) {
textCfg.textAlign = 'left';
}
if (index === total - 1) {
textCfg.textAlign = 'right';
}
return textCfg;
}
});
chart.tooltip({
showCrosshairs: true,
onShow:function(ev) {
var { items } = ev;
items[0].name = items[0].title;
}
});
chart.guide().tag({
position: [6, 2800],
content: '最高点',
offsetY: -5,
direct: 'tl'
});
chart.guide().tag({
position: [2, 2000],
content: '2000',
offsetY: -5,
direct: 'tc'
});
chart.area().position('time*tem');
chart.line().position('time*tem');
chart.render();
`);
}
}
|