<template>
<div>
<lt-canvas ref="canvas" :width="750" :height="500"></lt-canvas>
</div>
</template>
<script>
import LightChart from 'light-chart';
export default {
components:{
ltCanvas:require("light-chart/canvas")
},
data(){
return {}
},
mounted(){
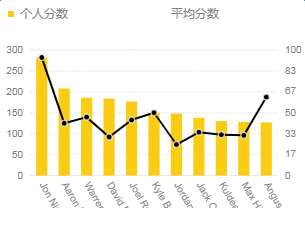
const data = [
{ name: 'Jon\nNicoll', score: 282, avgScore: 94 },
{ name: 'Aaron\nMaell', score: 208, avgScore: 41.6 },
{ name: 'Warren\nClunes', score: 186, avgScore: 46.5 },
{ name: 'David\nBolton', score: 184, avgScore: 30.67 },
{ name: 'Joel\nRobion', score: 177, avgScore: 44.25 },
{ name: 'Kyle\nBuckley', score: 150, avgScore: 50 },
{ name: 'Jordan\nLawrce', score: 148, avgScore: 24.67 },
{ name: 'Jack\nCarey', score: 138, avgScore: 34.5 },
{ name: 'Kuldeep\nPegu', score: 130, avgScore: 32.5 },
{ name: 'Max\nHiler', score: 128, avgScore: 32 },
{ name: 'Angus\nLivre', score: 127, avgScore: 62.5 }
];
const legendItems = [
{ name: '个人分数', marker: 'square', fill: '#FACC14', checked: true },
{
name: '平均分数',
marker: function(x, y, r, ctx) {
ctx.lineWidth = 1;
ctx.strokeStyle = ctx.fillStyle;
ctx.moveTo(x - r - 3, y);
ctx.lineTo(x + r + 3, y);
ctx.stroke();
ctx.arc(x, y, r, 0, Math.PI * 2, false);
ctx.fill();
},
fill: '#000',
checked: true
}
];
function findLegendItem(name) {
let index;
for(let i = 0; i < legendItems.length; i++) {
if (legendItems[i].name === name) {
index = i;
break;
}
}
return index;
}
let chart = new LightChart.Chart({
ltCanvas:this.$refs.canvas
});
chart.source(data, {
score: {
tickInterval: 50,
alias: '个人分数'
},
avgScore: {
ticks: [ 0, 17, 33, 50, 67, 83, 100 ],
alias: '平均分数'
}
});
chart.axis('avgScore', {
grid: null
});
chart.axis('name', {
label: {
rotate: Math.PI / 4,
textAlign: 'start',
textBaseline: 'middle'
}
});
chart.legend({
custom: true,
items: legendItems,
onClick(ev) {
const item = ev.clickedItem;
const name = item.get('name');
const checked = item.get('checked');
const children = item.get('children');
if (checked) {
const markerFill = children[0].attr('fill');
const textFill = children[1].attr('fill');
children[0].set('_originColor', markerFill);
children[1].set('_originColor', textFill);
}
const geoms = chart.get('geoms');
const canvas = chart.get('canvas');
for (let i = 0; i < geoms.length; i++) {
const geom = geoms[i];
const container = geom.get('container');
if (geom.getYScale().alias === name)
if (!checked) {
geom.show();
children[0].attr('fill', children[0].get('_originColor'));
children[1].attr('fill', children[1].get('_originColor'));
} else {
geom.hide();
children[0].attr('fill', '#bfbfbf');
children[1].attr('fill', '#bfbfbf');
}
item.set('checked', !checked);
legendItems[findLegendItem(name)].checked = !checked;
}
}
});
chart.interval().position('name*score').color('#FACC14');
chart.line().position('name*avgScore').color('#000');
chart.point().position('name*avgScore').size(3).style({
fill: '#000',
stroke: '#fff',
lineWidth: 1
});
chart.render();
}
}
</script>
<style scoped>
</style>
|