<template>
<div>
<lt-canvas ref="canvas" :width="750" :height="500"></lt-canvas>
</div>
</template>
<script>
import LightChart from 'light-chart';
export default {
components:{
ltCanvas:require("light-chart/canvas")
},
data(){
return {}
},
mounted(){
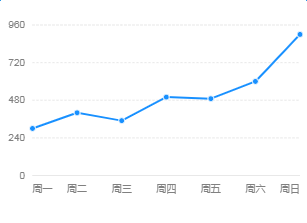
const data = [
{ day: '周一', value: 300 },
{ day: '周二', value: 400 },
{ day: '周三', value: 350 },
{ day: '周四', value: 500 },
{ day: '周五', value: 490 },
{ day: '周六', value: 600 },
{ day: '周日', value: 900 }
];
let chart = new LightChart.Chart({
ltCanvas:this.$refs.canvas
});
chart.source(data, {
value: {
tickCount: 5,
min: 0
},
day: {
range: [ 0, 1 ]
}
});
chart.axis('day', {
label(text, index, total) {
const textCfg = {};
if (index === 0) {
textCfg.textAlign = 'left';
}
if (index === total - 1) {
textCfg.textAlign = 'right';
}
return textCfg;
}
});
chart.line().position('day*value');
chart.point().position('day*value').style({
stroke: '#fff',
lineWidth: 1
});
chart.render();
}
}
</script>
<style scoped>
</style>
|