<template>
<div>
<lt-canvas ref="canvas" :width="750" :height="500"></lt-canvas>
</div>
</template>
<script>
import LightChart from 'light-chart';
export default {
components:{
ltCanvas:require("light-chart/canvas")
},
data(){
return {}
},
mounted(){
const Shape = LightChart.Shape;
Shape.registerShape('interval', 'triangle', {
getPoints(cfg) {
const x = cfg.x;
const y = cfg.y;
const y0 = cfg.y0;
const width = cfg.size;
return [
{ x: x - width / 2, y: y0 },
{ x: x, y: y },
{ x: x + width / 2, y: y0 }
]
},
draw(cfg, group) {
const points = this.parsePoints(cfg.points);
const polygon = group.addShape('polygon', {
attrs: {
points: [
{ x:points[0].x, y:points[0].y },
{ x:points[1].x, y:points[1].y },
{ x:points[2].x, y:points[2].y }
],
fill: cfg.color
}
});
return polygon;
}
});
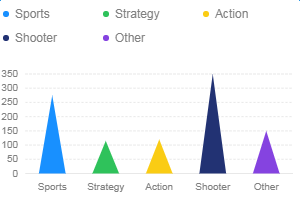
const data = [
{ genre: 'Sports', sold: 275 },
{ genre: 'Strategy', sold: 115 },
{ genre: 'Action', sold: 120 },
{ genre: 'Shooter', sold: 350 },
{ genre: 'Other', sold: 150 }
];
let chart = new LightChart.Chart({
ltCanvas:this.$refs.canvas
});
chart.source(data);
chart.interval().position('genre*sold').color('genre').shape('triangle');
chart.render();
}
}
</script>
|